
California King Tides 2026–27: Dates, Heights and What El Niño Adds
This winter's king tides fall on November 24 to 26, December 23 to 25 and January 21 to 22. NOAA predicts 7.02 ft at Port San Luis on December 24, and with El Niño holding the coast well above the tide tables, they could top the gauge's record.
Published Oct 27, 2026 · Updated Oct 29, 2026 · 7 min read · Nearest gauge Port San Luis / Morro Bay · NOAA 9412110
On this page
This winter's king tides arrive in three windows: November 24 to 26, December 23 to 25 and January 21 to 22. The biggest is the morning of Thursday, December 24, when NOAA predicts 7.02 ft at Port San Luis. That prediction is astronomy only. This year El Niño has been holding the water on the Central Coast close to a foot above the tables, so the real tides could top the highest reading at the gauge since 1980. The October spring tides already matched it.
Below are the dates and times for the Central Coast, why these tides are so high, what El Niño adds, and where to watch them.
The dates and times
Predicted highs and lows at Port San Luis, the gauge on Harford Pier that also serves Morro Bay and Cayucos. Heights are feet above MLLW; times are Pacific Standard Time. Bold marks the peak day of each window.
| Day | Morning high | Afternoon low |
|---|---|---|
| Mon Nov 23 | 6.59 ft, 7:53 am | −0.92 ft, 3:15 pm |
| Tue Nov 24 | 6.85 ft, 8:31 am | −1.29 ft, 4:02 pm |
| Wed Nov 25 | 6.93 ft, 9:14 am | −1.46 ft, 4:52 pm |
| Thu Nov 26 | 6.81 ft, 10:00 am | −1.43 ft, 5:44 pm |
| Fri Nov 27 | 6.48 ft, 10:53 am | −1.22 ft, 6:37 pm |
| Tue Dec 22 | 6.77 ft, 7:29 am | −1.45 ft, 3:07 pm |
| Wed Dec 23 | 6.99 ft, 8:16 am | −1.76 ft, 3:54 pm |
| Thu Dec 24 | 7.02 ft, 9:04 am | −1.85 ft, 4:41 pm |
| Fri Dec 25 | 6.83 ft, 9:54 am | −1.72 ft, 5:28 pm |
| Sat Dec 26 | 6.40 ft, 10:47 am | −1.39 ft, 6:14 pm |
| Wed Jan 20 | 6.60 ft, 7:18 am | −1.66 ft, 2:54 pm |
| Thu Jan 21 | 6.78 ft, 8:10 am | −1.84 ft, 3:37 pm |
| Fri Jan 22 | 6.75 ft, 9:00 am | −1.80 ft, 4:19 pm |
| Sat Jan 23 | 6.46 ft, 9:49 am | −1.52 ft, 4:59 pm |
For comparison, an average day's higher high at Port San Luis (mean higher high water, MHHW) is 5.33 ft. Every king tide morning above runs a foot to a foot and three quarters over that.
The Port San Luis / Morro Bay tide calendar shows the next 14 days with sunrise and sunset, so check it again the week before each window.
Up and down the Central Coast
The peak highs at three Central Coast gauges with live water levels:
| Gauge | Wed Nov 25 | Thu Dec 24 | Thu Jan 21 |
|---|---|---|---|
| Santa Barbara | 7.05 ft, 8:54 am | 7.17 ft, 8:46 am | 6.93 ft, 7:53 am |
| Port San Luis | 6.93 ft, 9:14 am | 7.02 ft, 9:04 am | 6.78 ft, 8:10 am |
| Monterey | 6.86 ft, 9:39 am | 7.03 ft, 9:27 am | 6.82 ft, 8:30 am |
The high reaches Santa Barbara first and Monterey about 40 minutes later. That is the tide wave travelling north up the coast, which Why California gets two unequal tides a day explains. Each height is measured from that station's own MLLW, so the numbers say how big the tide is at each place, not which town floods first.
Why these tides are so high
A king tide is a perigean spring tide in winter. Spring tides come twice a month, when the sun and moon line up at new and full moon. When that lines up with perigee, the moon's closest point to Earth, its pull is stronger and the tide gets a few inches bigger. Earth is also closest to the sun in early January.
December's window is the strongest of the three because the full moon and perigee fall within about seven hours of each other on December 24 (UTC). The Tide School lesson on mixed tides covers spring tides, perigee and king tides in more detail.
What El Niño adds this year
Tide predictions are astronomy only. They can't see storms, swell, air pressure or warm water. The difference between what the gauge measures and what NOAA predicted is the residual, and this fall it has been large.
- Our Kelvin wave post tracked the 2026 El Niño's Kelvin wave arriving in late September. By mid October, gauges from La Jolla to San Francisco were running 9 to 13 inches above prediction.
- On October 27 the Port San Luis gauge was still running about 1.1 ft above prediction.
- During Tropical Storm Rachel on October 10, Port San Luis reached 7.14 ft, 1.36 ft over the predicted high.
If the water is still running high in December, simple addition puts the December 24 morning tide here:
| If the water runs… | Dec 24 high at Port San Luis |
|---|---|
| On prediction | 7.02 ft |
| 0.5 ft above | about 7.5 ft |
| 1.0 ft above (about where it was on Oct 27) | about 8.0 ft |
| 1.36 ft above (Rachel, Oct 10) | about 8.4 ft |
For scale, the highest monthly reading at the gauge from 1980 to September 2026 was 7.64 ft in January 2005, and the El Niño storm of January 27, 1983 reached 7.58 ft. The October spring tides matched that record: 7.66 ft on October 27 and 7.68 ft on October 28, both preliminary readings (our Kelvin wave post has the details). This table is arithmetic, not a forecast: the residual changes from day to day, and the World Meteorological Organization expects the El Niño to peak around December. But it shows why a king tide this winter needs more attention than the usual photo op. A king tide on its own rarely floods much. A king tide on high water with a winter storm and big swell on top is what floods parking lots, beach access and low streets.
The gauge sits in a sheltered harbor. On an open beach in a big swell, wave setup and run-up push the water much farther up the sand than the gauge shows. When the tide doesn't match the prediction explains both.
Where to watch on the Central Coast
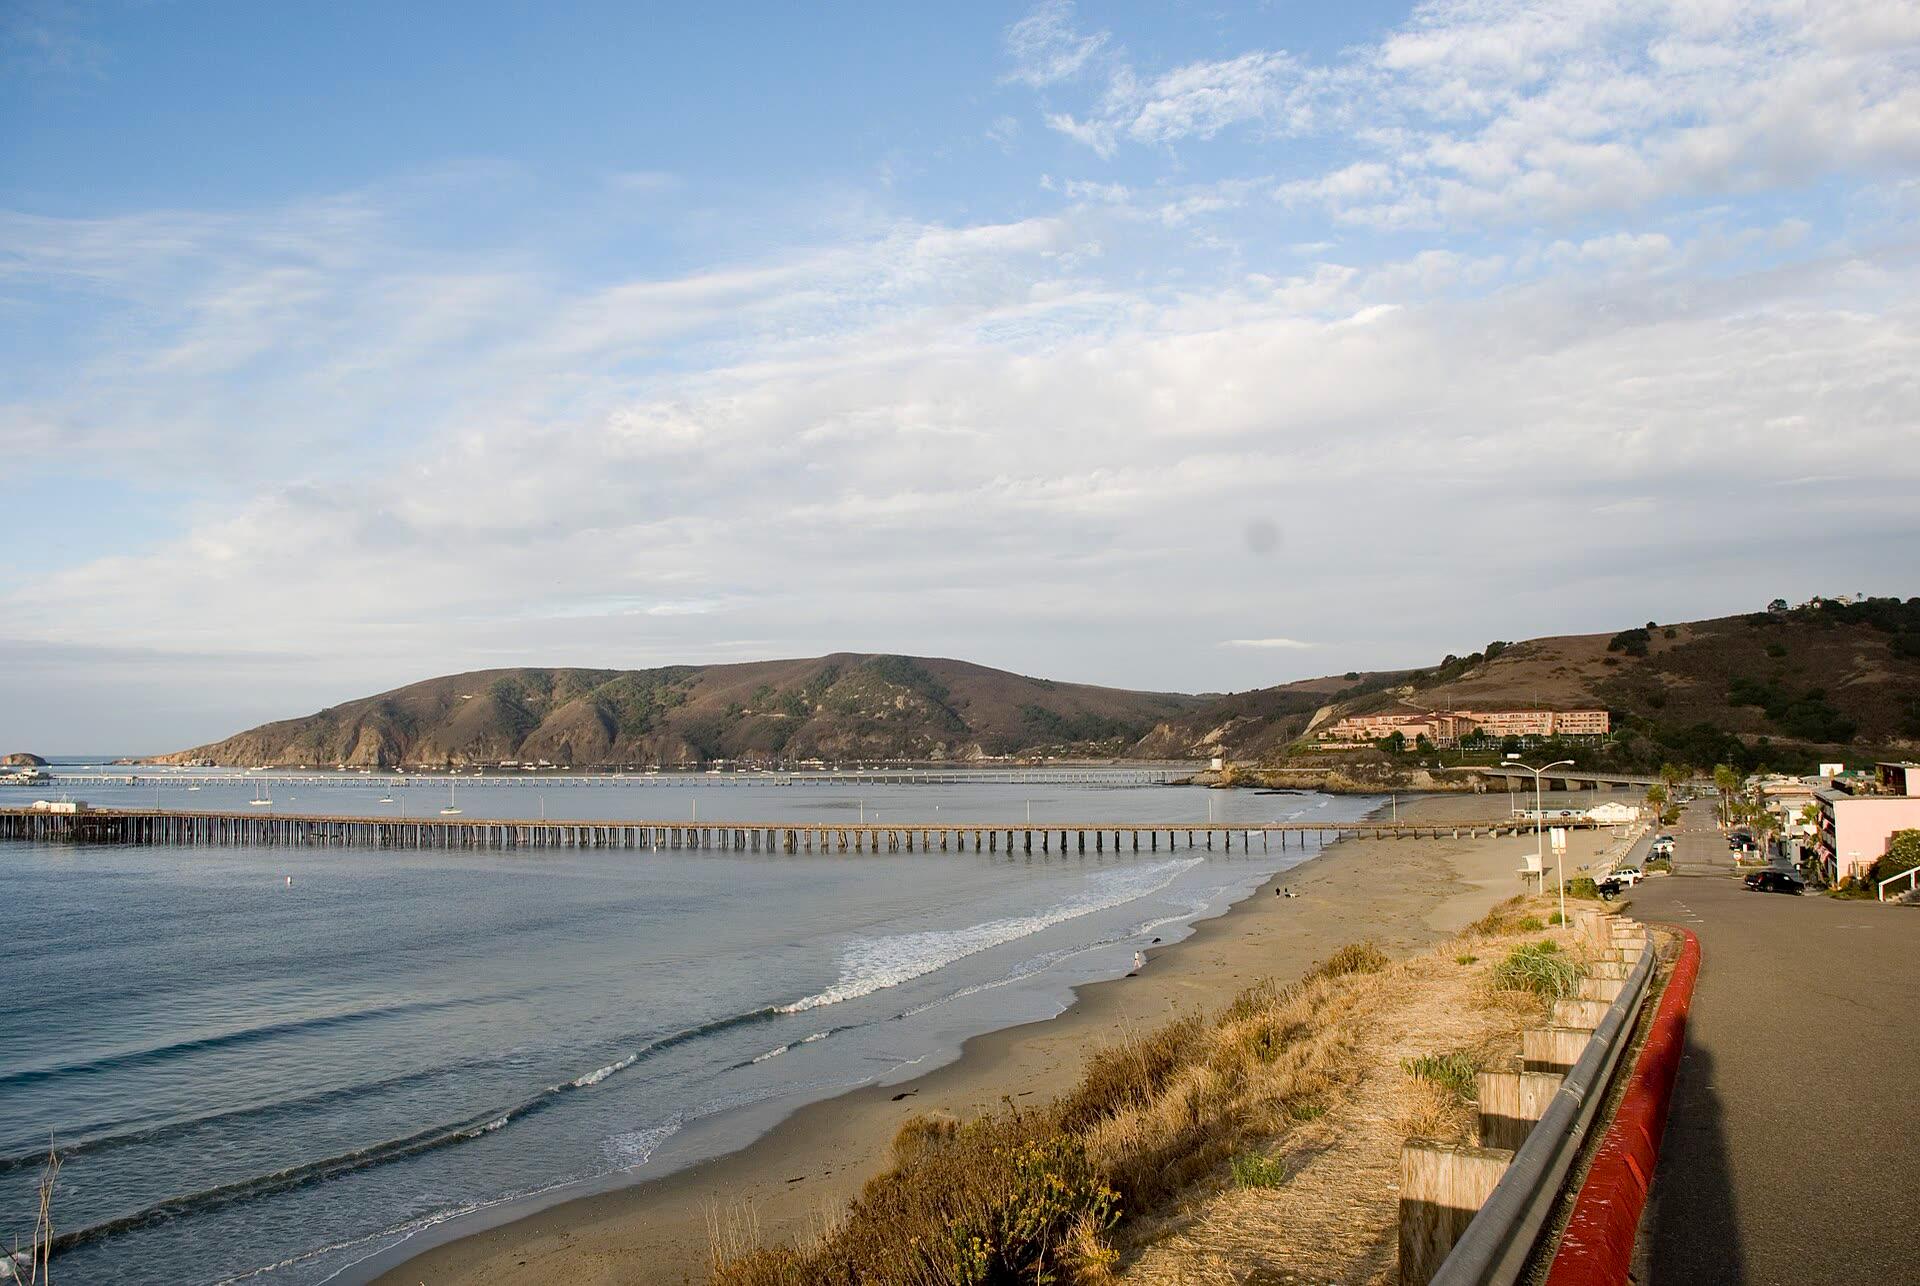
- Avila Beach and Port San Luis. Harford Pier holds the gauge itself. Watch the promenade seawall along Front Street and the beach parking lots on the morning highs.
- Morro Bay. Watch the low sections of the Embarcadero and the marsh edges at the back of the bay. Cal Poly and California State Parks have run king tide photo walks from the Morro Bay Natural History Museum, with sites in walking distance along the bay. More in our Morro Bay travel guide.
- Cayucos. The beachfront and the pier approach take a west swell on a high tide head-on.
- Go at the high, not after. The morning highs fall between about 7:20 and 11 am. Arrive half an hour before and watch the last of the rise.
Stay off jetties, seawalls, the Morro Bay sandspit and low rocky points at the top of the tide. Never drive or walk through flooded roads, and never turn your back on the ocean.
Photograph them for the King Tides Project
The California Coastal Commission's California King Tides Project asks the public to photograph the shoreline during these windows as a preview of everyday water levels with future sea-level rise. Share photos with #KingTides or add them to the project's photo map. Shoot something with a fixed reference, like a pier piling, a seawall or a stairway, so the water level reads clearly.
The minus tides that come with them
The same alignment that pushes the morning highs up pulls the afternoon lows down. Every king tide day also has a minus tide of −1.3 to −1.85 ft, among the lowest of the year. In November and December those lows land late in the afternoon, close to or after sunset, so bring a headlamp and plan to be off the reef before dark. January's come in good daylight, around 3 to 4:30 pm. Best Tide Pools in California and the tidepool planner cover where and when to go.
How to watch it live
- The Conditions Console shows the Port San Luis residual, so you can see how far above the table the water is running that morning.
- Tide Intelligence draws the last three days of measured water over the predicted curve.
- The Coast Map shows the tide at every California station at once.
Sources
- NOAA Tides & Currents predictions and datums for Port San Luis (9412110), Santa Barbara (9411340) and Monterey (9413450), retrieved October 27, 2026. Datums use the 1983 to 2001 epoch.
- California King Tides Project, California Coastal Commission: 2026–27 statewide dates.
- Cold Moon 2026, Universal Time Date: December 24 full moon and perigee times.
- Cal Poly and California State Parks king tide walk, December 2025.
- Gauge records, Rachel readings and Kelvin wave residuals: our Kelvin wave post.
Keep reading
Surfing · Fishing · Tidepooling · Kayaking · Avila · Morro Bay · Cambria · California coast · 9 min
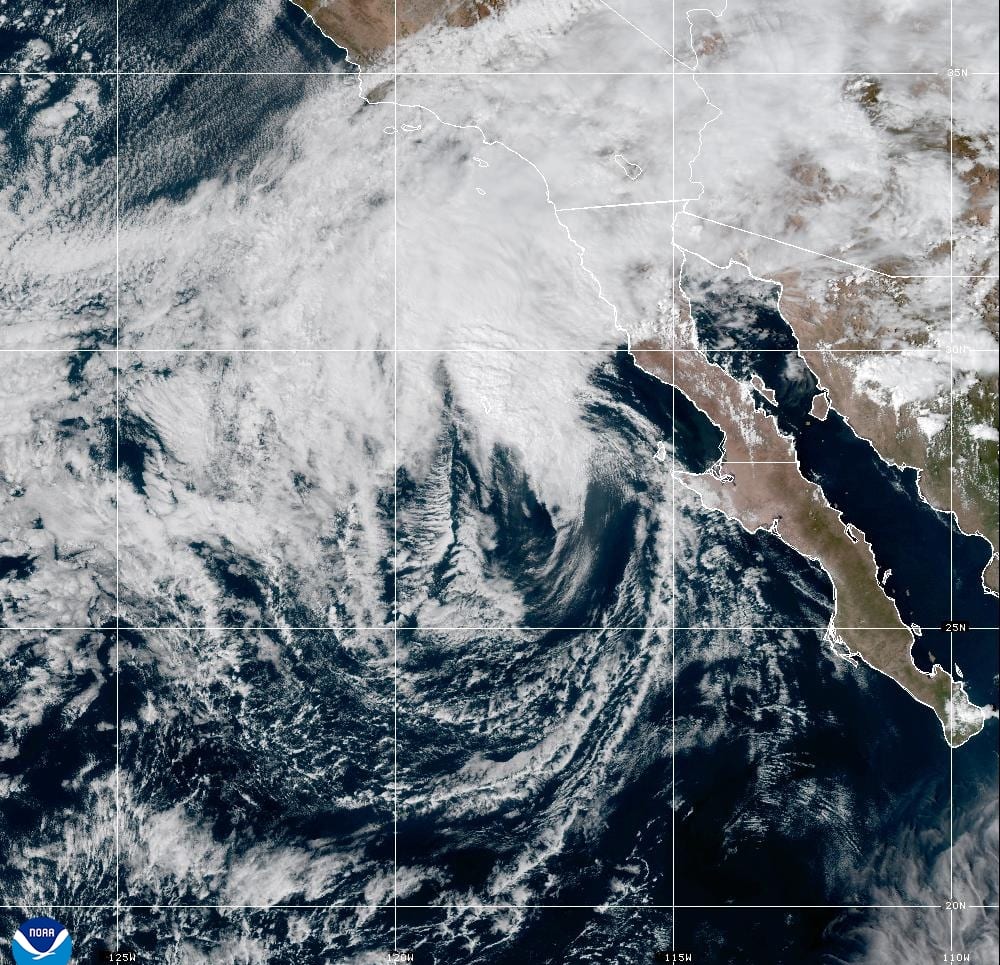
Tropical Storm Rachel: Its Track, the Timeline and What It Means for the Central Coast
Rachel, a major hurricane last week, is expected to make landfall in northern Baja as a tropical storm tonight. The Central Coast is far from the center, but it gets high surf, tides running more than a foot above the tables, coastal flood advisories from Big Sur to Santa Barbara County, and light rain Sunday night into Monday.
Surfing · Fishing · Tidepooling · Wildlife · Avila · Morro Bay · California coast · 9 min
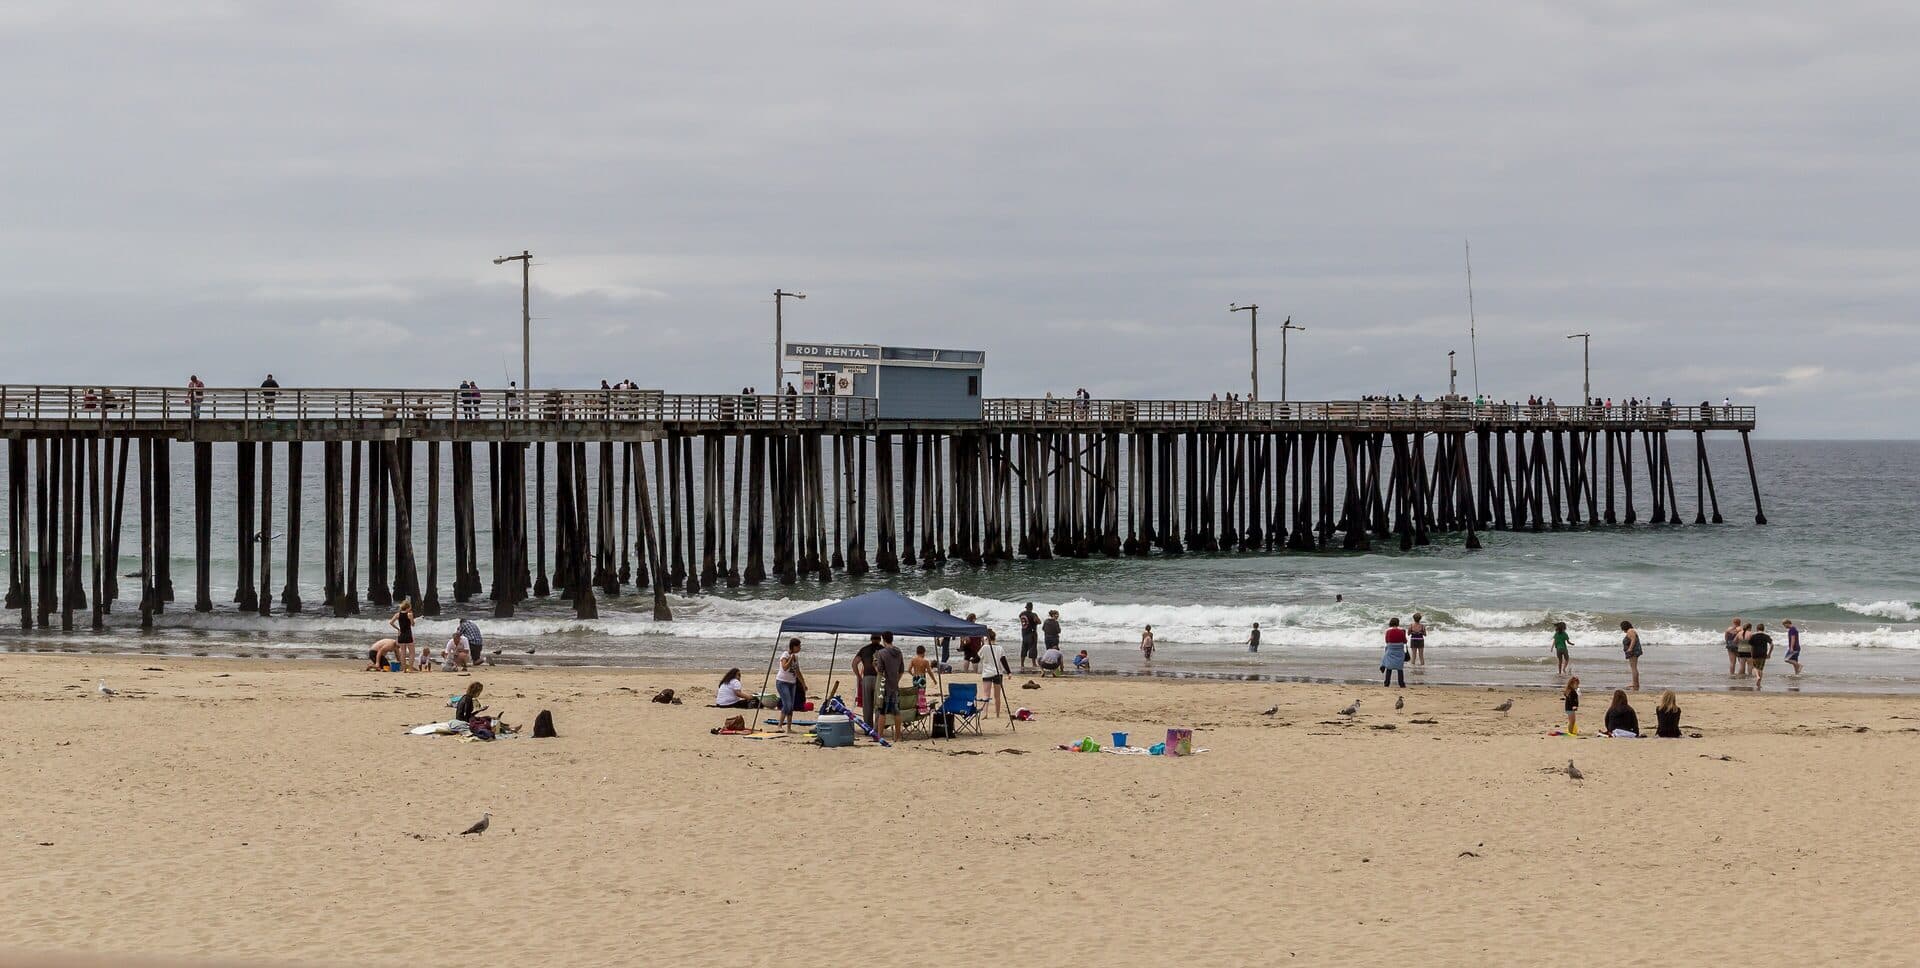
El Niño 2026: Where It Stands and What It Means for the California Coast
A very strong, possibly record El Niño is building into winter. Where the forecasts stand in October 2026, what's already showing up off the Central Coast (warm water, higher tides, southern fish), and how to plan surf, fishing and tidepool days around a stormy season.
Surfing · Fishing · Tidepooling · Avila · Morro Bay · California coast · 27 min
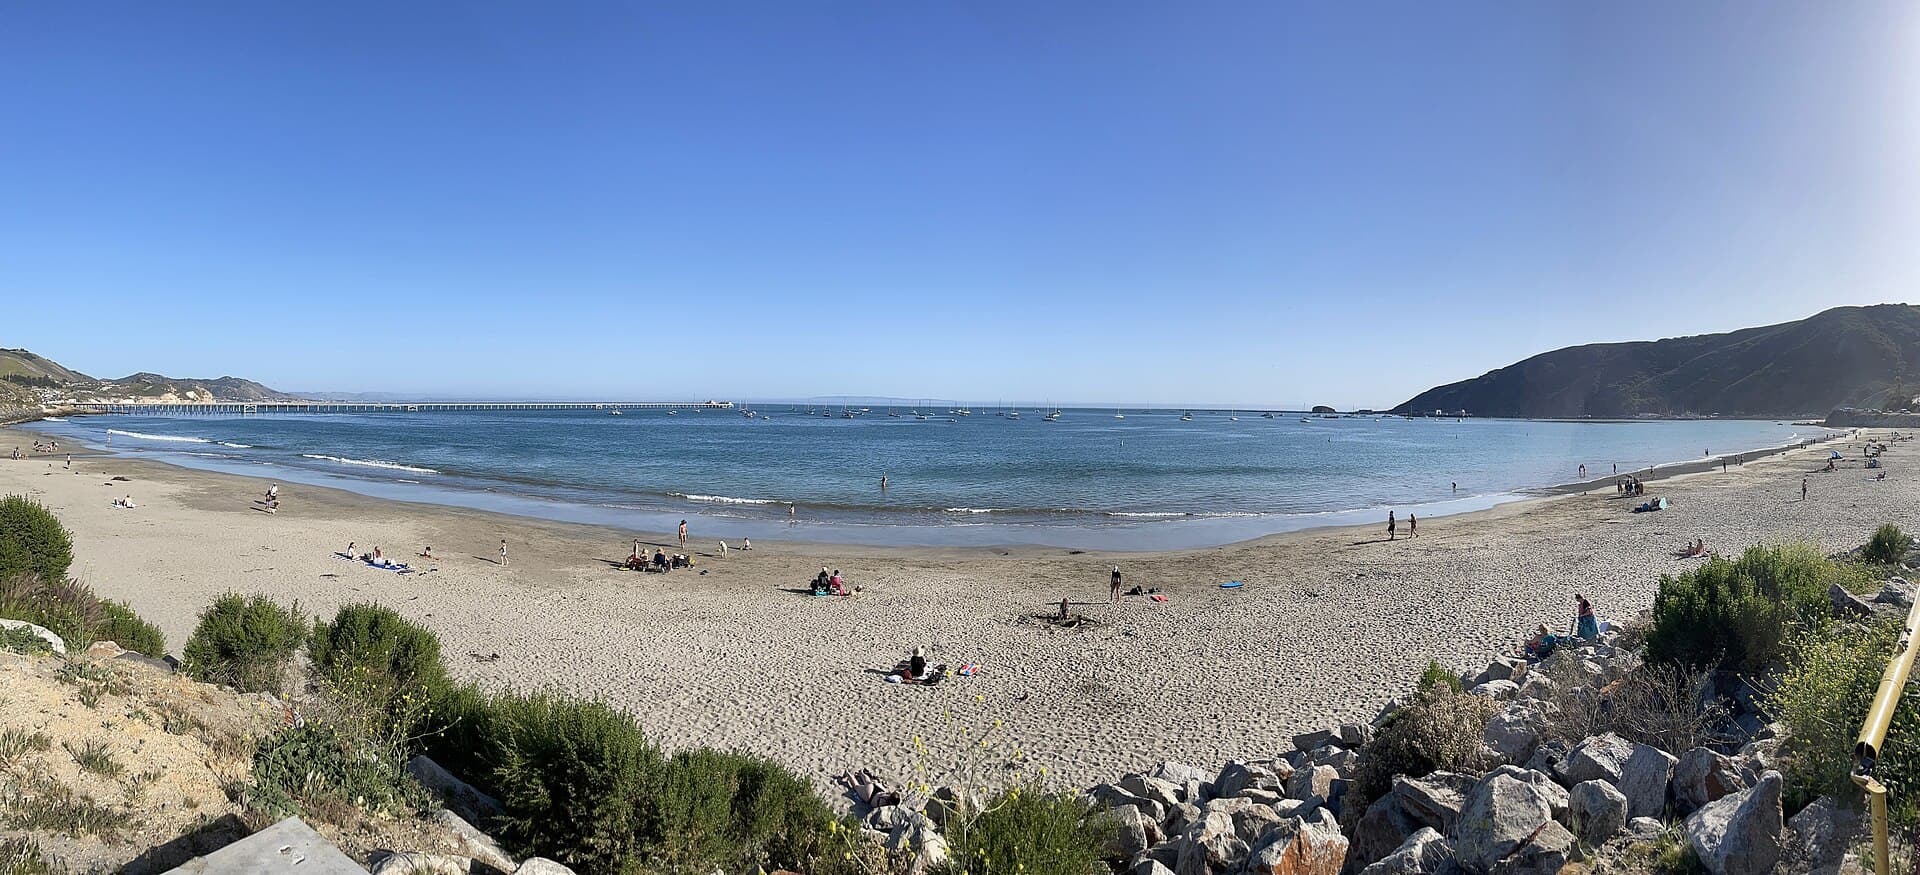
The Kelvin Wave Reaching California: What the Tide Gauges Show
Updated October 28: NOAA gauges from La Jolla to San Francisco ran 12 to 17 inches above prediction in late October, and Port San Luis reached 7.68 ft on October 28, a fraction of an inch above its highest reading since 1980. What the Kelvin wave is, what the gauges show, and what it means for Central Coast king tides this winter.